A picture paints a thousand ~words~ tokens, right?
With almost no software, and even less effort, you can get a computer to interpret complex physical systems from plots. This time last week that was difficult.
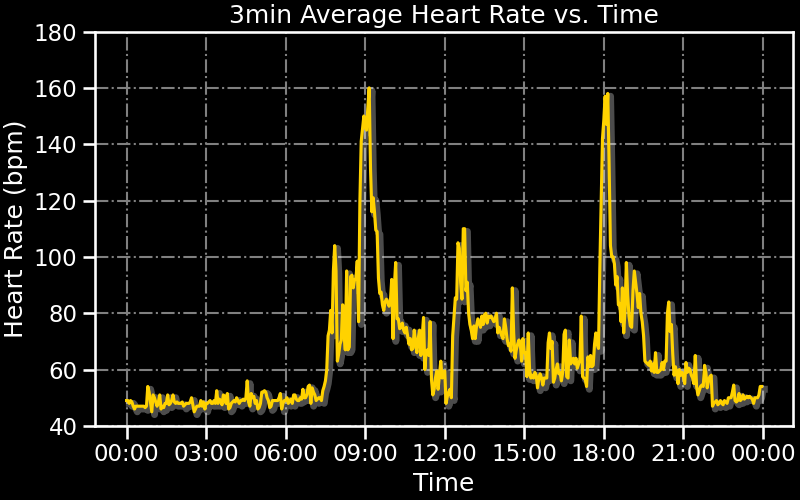
I gave GPT-4V, available publicly since last Monday (written 2023-11-06-ish), this plot of heart rate and asked "Here's a plot of heart rate for one day. Describe what happens and what the user might be doing?"
The response understood - and I use the word advisedly - that I woke up about seven, that probably ran or cycled to work and back, and that I went to bed between 21:00 and midnight. All correct.
That might not seem much but think of what had to happen: * Understanding that this is a graph of something vs time, and what a graph is. * Interpreting the axes and reading values from the graph. * Understanding - that word again - that the values represent the measurement of a physical system, and hypothesising how the inputs to that system could influence the output.
This took about 1000 tokens, and cost about two cents. All just to tell me I'm not as fit as I used to be.
The raw response looked something like this:
The graph displays a 3-minute average heart rate over a full day. Here's a breakdown of what the data suggests:
From 00:00 to about 07:00, the heart rate is relatively low and stable, fluctuating slightly but generally staying within a narrow band. This pattern suggests that the person was resting or sleeping or sleeping during these hours.
Starting around 09:00, there is a significant increase in heart rate, with a peak reaching 140 bpm. This spike could indicate the person engaging in morning exercise.
After the morning activity, the heart rate returns to a lower level but trends higher than the resting level seen at the beginning of the graph. This elevated heart rate could suggest a transition to less intense activities or regular daily activities such as getting ready for the day, commuting, or working.
Over the course of the day, there are several spikes in heart rate. The most notible peaks are around 09:00, 15:00, and just before 18:00, each reaching a range of 100 - 140 bpm. These peaks could correlate with additional bouts of exercise, stressful events, or moments of high physical activity.
Between these spikes, the heart rate varies but tends to stay above the resting level observed at the start of the day, consistent with the level of physical activity that would occur on an average day.
From around 21:00 onwards, the heart rate begins to decrease and shows signs of returning to a lower resting state, suggesting that the person may be winding down and preparing for rest or sleep.
Please note the that this interpretation assumes the heart rate data is from a healthy adult and that the variations are solely due to physical activity, which may not always be the case. Diet, emotions, stress levels, medication, or medical conditions can also influence heart rate.